


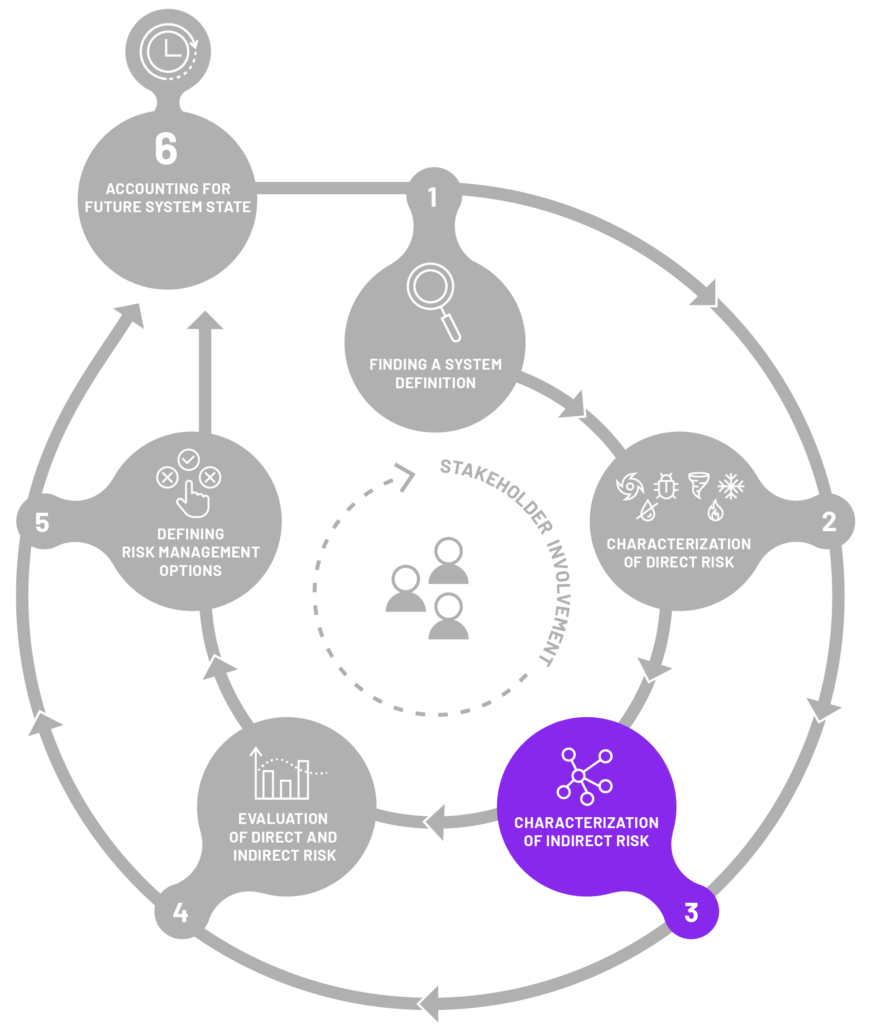
CHARACTERIZATION
OF INDIRECT RISK
Step 3 aims to understand indirect risks stemming from the fact that a hazard event’s direct impact can lead to indirect impacts. These impacts are not directly caused by the hazard itself but are still connected to the event due to interconnections between different elements of the system. In other words, we analyze which system elements identified in Step 1 and influenced by direct risks in Step 2 would be indirectly impacted. Such consequences may occur in different locations and timeframes compared to the initial event (i.e. with a time lag between the hazard event and the occurance of indirect impacts or indirect impacts might manifest in different geographical areas)
Similar to Step 2, the indirect impacts can be either tangible (e.g., other firms going bankrupt due to supply chain disruptions) or intangible (e.g., loss of cultural heritage, biodiversity). Some of these indirect impacts can be measured using market-based indicators, such as expressing them in monetary terms, or other indicators, such as a decrease in physical and psychological health. Examples for indirect impacts include business disruptions due to damaged transportation routes or disrupted supply chains, increased debt levels, decreased financial stability and more.
Guidance protocol questions
The following are questions that can help decision-makers, stakeholders, and relevant parties in successfully walking through step 3 of the framework. Consider this set of questions as an initial guide for your investigation, recognizing that it is not an exhaustive list.

Indirect impacts
- What are the indirect impacts natural hazards have on your system elements?
Such effects include, for instance, ripple effects along supply chains causing business or supply chain interruption, and change in economic productivity.
- Please note that some of the impacts the system owner is experiencing do not come from the impact on their own system, but are due to their connectedness and dependencies on other systems.
For instance, small-scale businesses in country X can be impacted due to a hazard impacting production in country Y.
Indirect risk metrics
- What are the main indirect impacts of interest for you as a system owner?
For instance, the transport sector might be interested in minimizing economic costs to transportation due to drought impacting agriculture.
- What are the metrics for these impacts?
For example, this could be decreased economic output due to interruptions in supply chains
Dynamics of exposure, vulnerability, and impacts
Consider how changes in vulnerability and exposure apply to indirect risks.
For example, if small businesses are already affected by supply chain problems, they could become even more vulnerable if they are also directly impacted by a hazard.
Similar to direct risk, think of changes to vulnerability and exposure for indirect risks. For instance, small businesses impacted by supply chain interruptions could be more vulnerable in case they are additionally also directly affected by another hazard.
As in the previous step of the framework, we are referring to the fictitious multi-hazard event in the Danube Region to exemplify the process of navigating through this stage of the framework. This serves as a practical illustration of how to approach this step and how to address the guidance protocol questions mentioned earlier, using our hypothetical scenario as a guide.
CONCEPTUAL EXAMPLE
There was a drought in the Danube Region (e.g. like the 2015 or 2022 drought) that left severe consequences across sectors. After several months, the region is hit by a severe flood (e.g. like the 2006 flood) causing severe loss and damage.

Example of indirect impacts
- damage to transport infrastructure influencing agricultural supply chains
- agricultural losses influencing national and regional supply chains
- increase in food insecurity
- damage to transport infrastructure impacting accessibility to health care
- large insurance payments increase premiums
- increase in interest rates for loans
- decrease in business performances across regions due to opportunity costs
- decrease in productivity
Risk metric
Costs of disrupted supply chains, decrease in purchasing power, increased indebtedness,…
