
- STEPS
- Finding a system definition
- Characterisation of direct risk
- Characterisation of indirect risk
- Evaluation of direct and indirect risk
- Accounting for future system rate
Multi-risk scenarios
Introduction
We are working on developing A software for simulating multi-hazard and multi-risk scenarios across Europe. Myriad-EU helps assess risks to various sectors and has developed exposure metrics that cover population, infrastructure, agriculture, and economic activity, among others. These metrics are essential for evaluating the potential effects of natural hazards such as earthquakes, volcano, floods, and wildfires.
We created methods for generating future event sets and for quantifying risk, which include both direct and indirect risk. This has involved extending individual hazard data to a multi-hazard context and formulating vulnerability models. That work will result in the development of a set of software tools for risk estimation.
These tools can operate at a broad European scale with generalized loss parameters or at a local scale with detailed parameters. We introduced a web-based Scorecard, which integrates various data types to assess disaster risk management performance. The software allows for the identification of multi-hazard events by setting threshold levels for hazard intensities and risk metrics. This makes it easier to analyze how different natural hazards might combine and what effects they could have.
To date, we have made substantial progress in developing these tools and methods, which are being applied in case-specific scenarios, particularly for the MYRIAD-EU pilot regions (Canary Islands, Danube, North Sea, Scandinavia, Veneto). We strive to provide an accessible and practical approach to multi-hazard and multi-risk scenario analysis for diverse users and stakeholders.
Application of Methods and Tools within the Framework
Finding a system definition
In our analysis of systemic risks across Europe, we’ve defined specific regions and sectors to better understand and address the challenges they face. This analysis spans five pilot regions including the Canary Islands, Danube, North Sea, Scandinavia, and Veneto, and delves into six critical sectors: Ecosystems & Forestry, Energy, Finance, Food & Agriculture, Infrastructure & Transport, and Tourism. By allowing the user to specify a region and sector when simulating the software enables the user to define their own system for generating multi-hazard and multi-risk scenarios.
Datasets for European Scale and pilot regions
The identification of relevant datasets is crucial to understanding the risks that could impact the system under review. The software draws upon the following datasets in its analysis of risks for each region and sector.
- Hazard Sets on a European Scale
- Historical Hazard Footprints + Locations
- Stochastic Event Sets of Relevance
- Probabilistic Event Sets of Relevance
- MYRIAD-HESA
- Further Multi-Hazard Event Sets
- Exposure Sets on a European Scale for use in risk modelling
- Vulnerability Sets on a European Scale per hazard (Extracted Database and usage method)
- Risk Sets on a European Scale
- Historical Losses on a European Scale
Characterisation of direct risk
General Direct Damage Methodology:
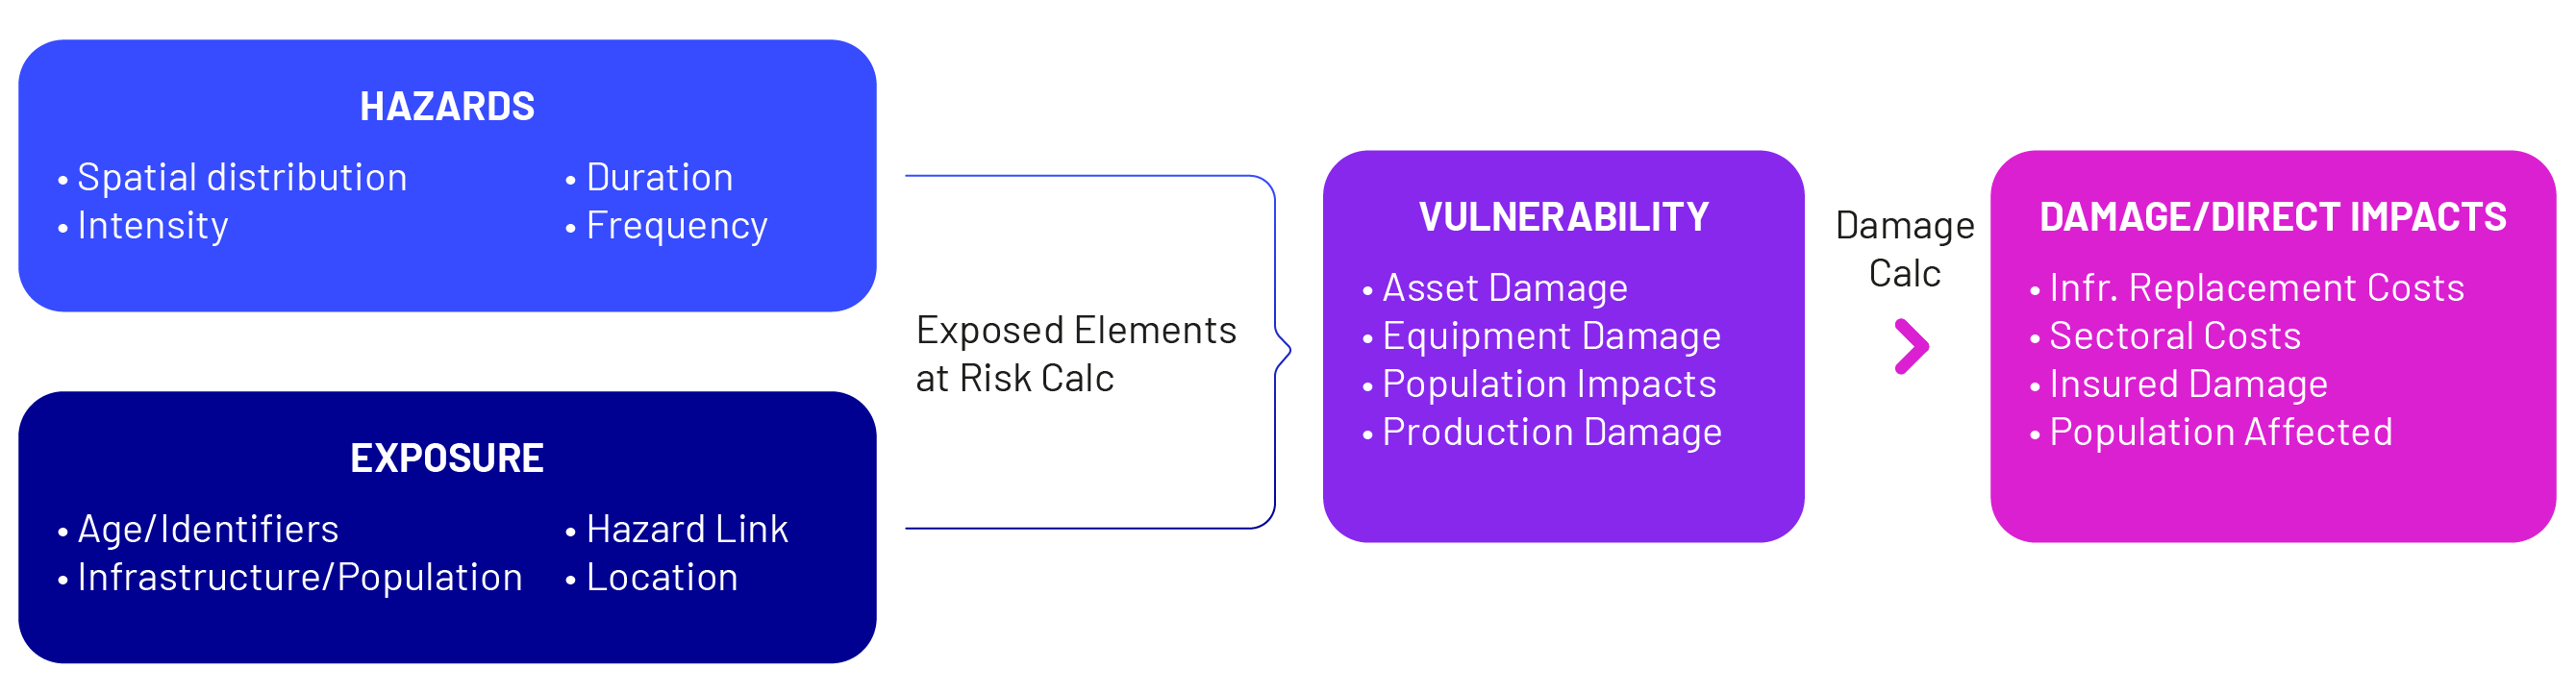
Understanding and defining individual hazards is crucial for quantifying direct impacts. The figure below illustrates how direct impacts are calculated in the software and incorporation of this methodology was a critical step in software development. The basic model components are hazard, exposure, and vulnerability of any exposed elements, which transfers through to risk of direct impacts.
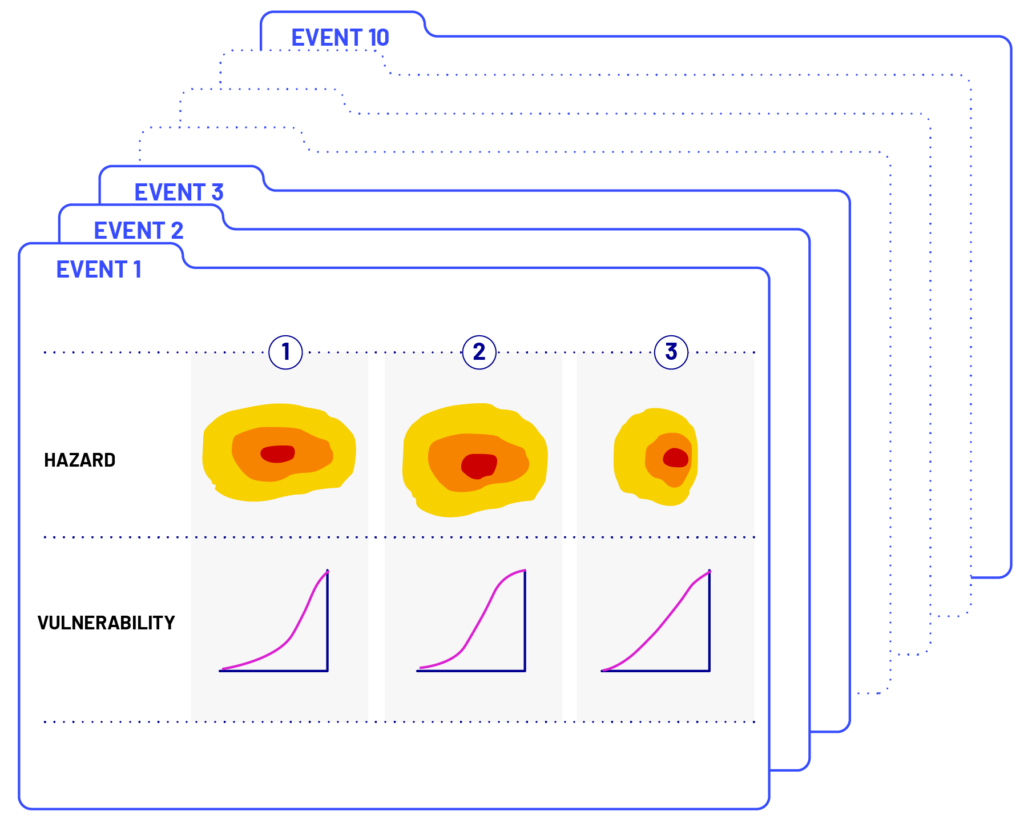
Stochastic Event Set Production:
The characterization of direct risk through stochastic event set production is crucial for understanding potential damages from discrete events over time. By employing models that simulate different scenarios, this approach provides valuable metrics to help quantify expected losses and identify risk thresholds, thereby facilitating better planning and risk management strategies in various sectors. The following risk metrics are incorporated into the software:
- AAL (Average Annual Loss): describes the expected monetary loss per year, considering the probability of different events occurring. It's an average value derived from a stochastic model that runs many simulations to account for the uncertainty and variability of the risks.
- AAD (Average Annual Damage): similar to AAL, this refers to the average cost of damages that can be expected annually due to risk events.
- PML (Probable Maximum Loss): typically used in the insurance industry to describe the maximum loss that is likely to occur with a certain probability. For instance, the maximum damage expected from a disaster with a 1% chance of occurring in any given year.
- TVaR (Tail Value at Risk): this not only considers the amount of loss but also the severity of that loss in the worst-case scenarios. It's a way of asking, "If things go bad, how bad could they really get?"
To evaluate the direct risks associated with various sectors effectively, we utilize a detailed Sectoral Direct Damage Methodology. The following shows the sectors we consider along with the metrics associated with direct impacts in each sector.
Sectoral Direct Damage Methodology
| Sector | Potential Direct Metrics (depending) |
|---|---|
| Finance | Investment & Built Stocks: Replacement, Reconstruction, Depreciated Cost, Insurance Cost, Contents Included. A21 Capital Stock damage (AAL, Scenario, PML) |
| Infrastructure & Energy | Useability and Damage Analysis (length damaged), % Network Connectivity Loss (Canary implementation) |
| Agriculture | Direct crop and livestock damage |
| Tourism | Hotel damage, Capital damage |
| Ecosystems | Direct Environmental Impact |
| Cross Sector | Fatality & Disruption Functions, Displacement Functions, Sectoral Capital Damage |
CHARACTERIZATION OF INDIRECT RISK
To accurately assess the broader economic and societal impacts of natural hazards, our methodology includes a general model for evaluating indirect losses. Here’s an overview of our approach:
Indirect risk methodology
- General model for indirect losses
Inter-European indirect impacts
- Models with pan-European capability
- GRACE (Scandinavian Pilot)
- Agent-Based Modeling (ABM) (Danube)
- Multiregional Impact Assessment Model (MRIA)
- Hazard sets will be applied to single and multiple regions
- Outputs
- Impacts of remote hazards on pilot regions
- Impacts of local hazards on other EU countries
- Reference for indirect effects of local hazards
- Comparison of importance of direct and indirect effects
Evalutation of direct and indirect risks
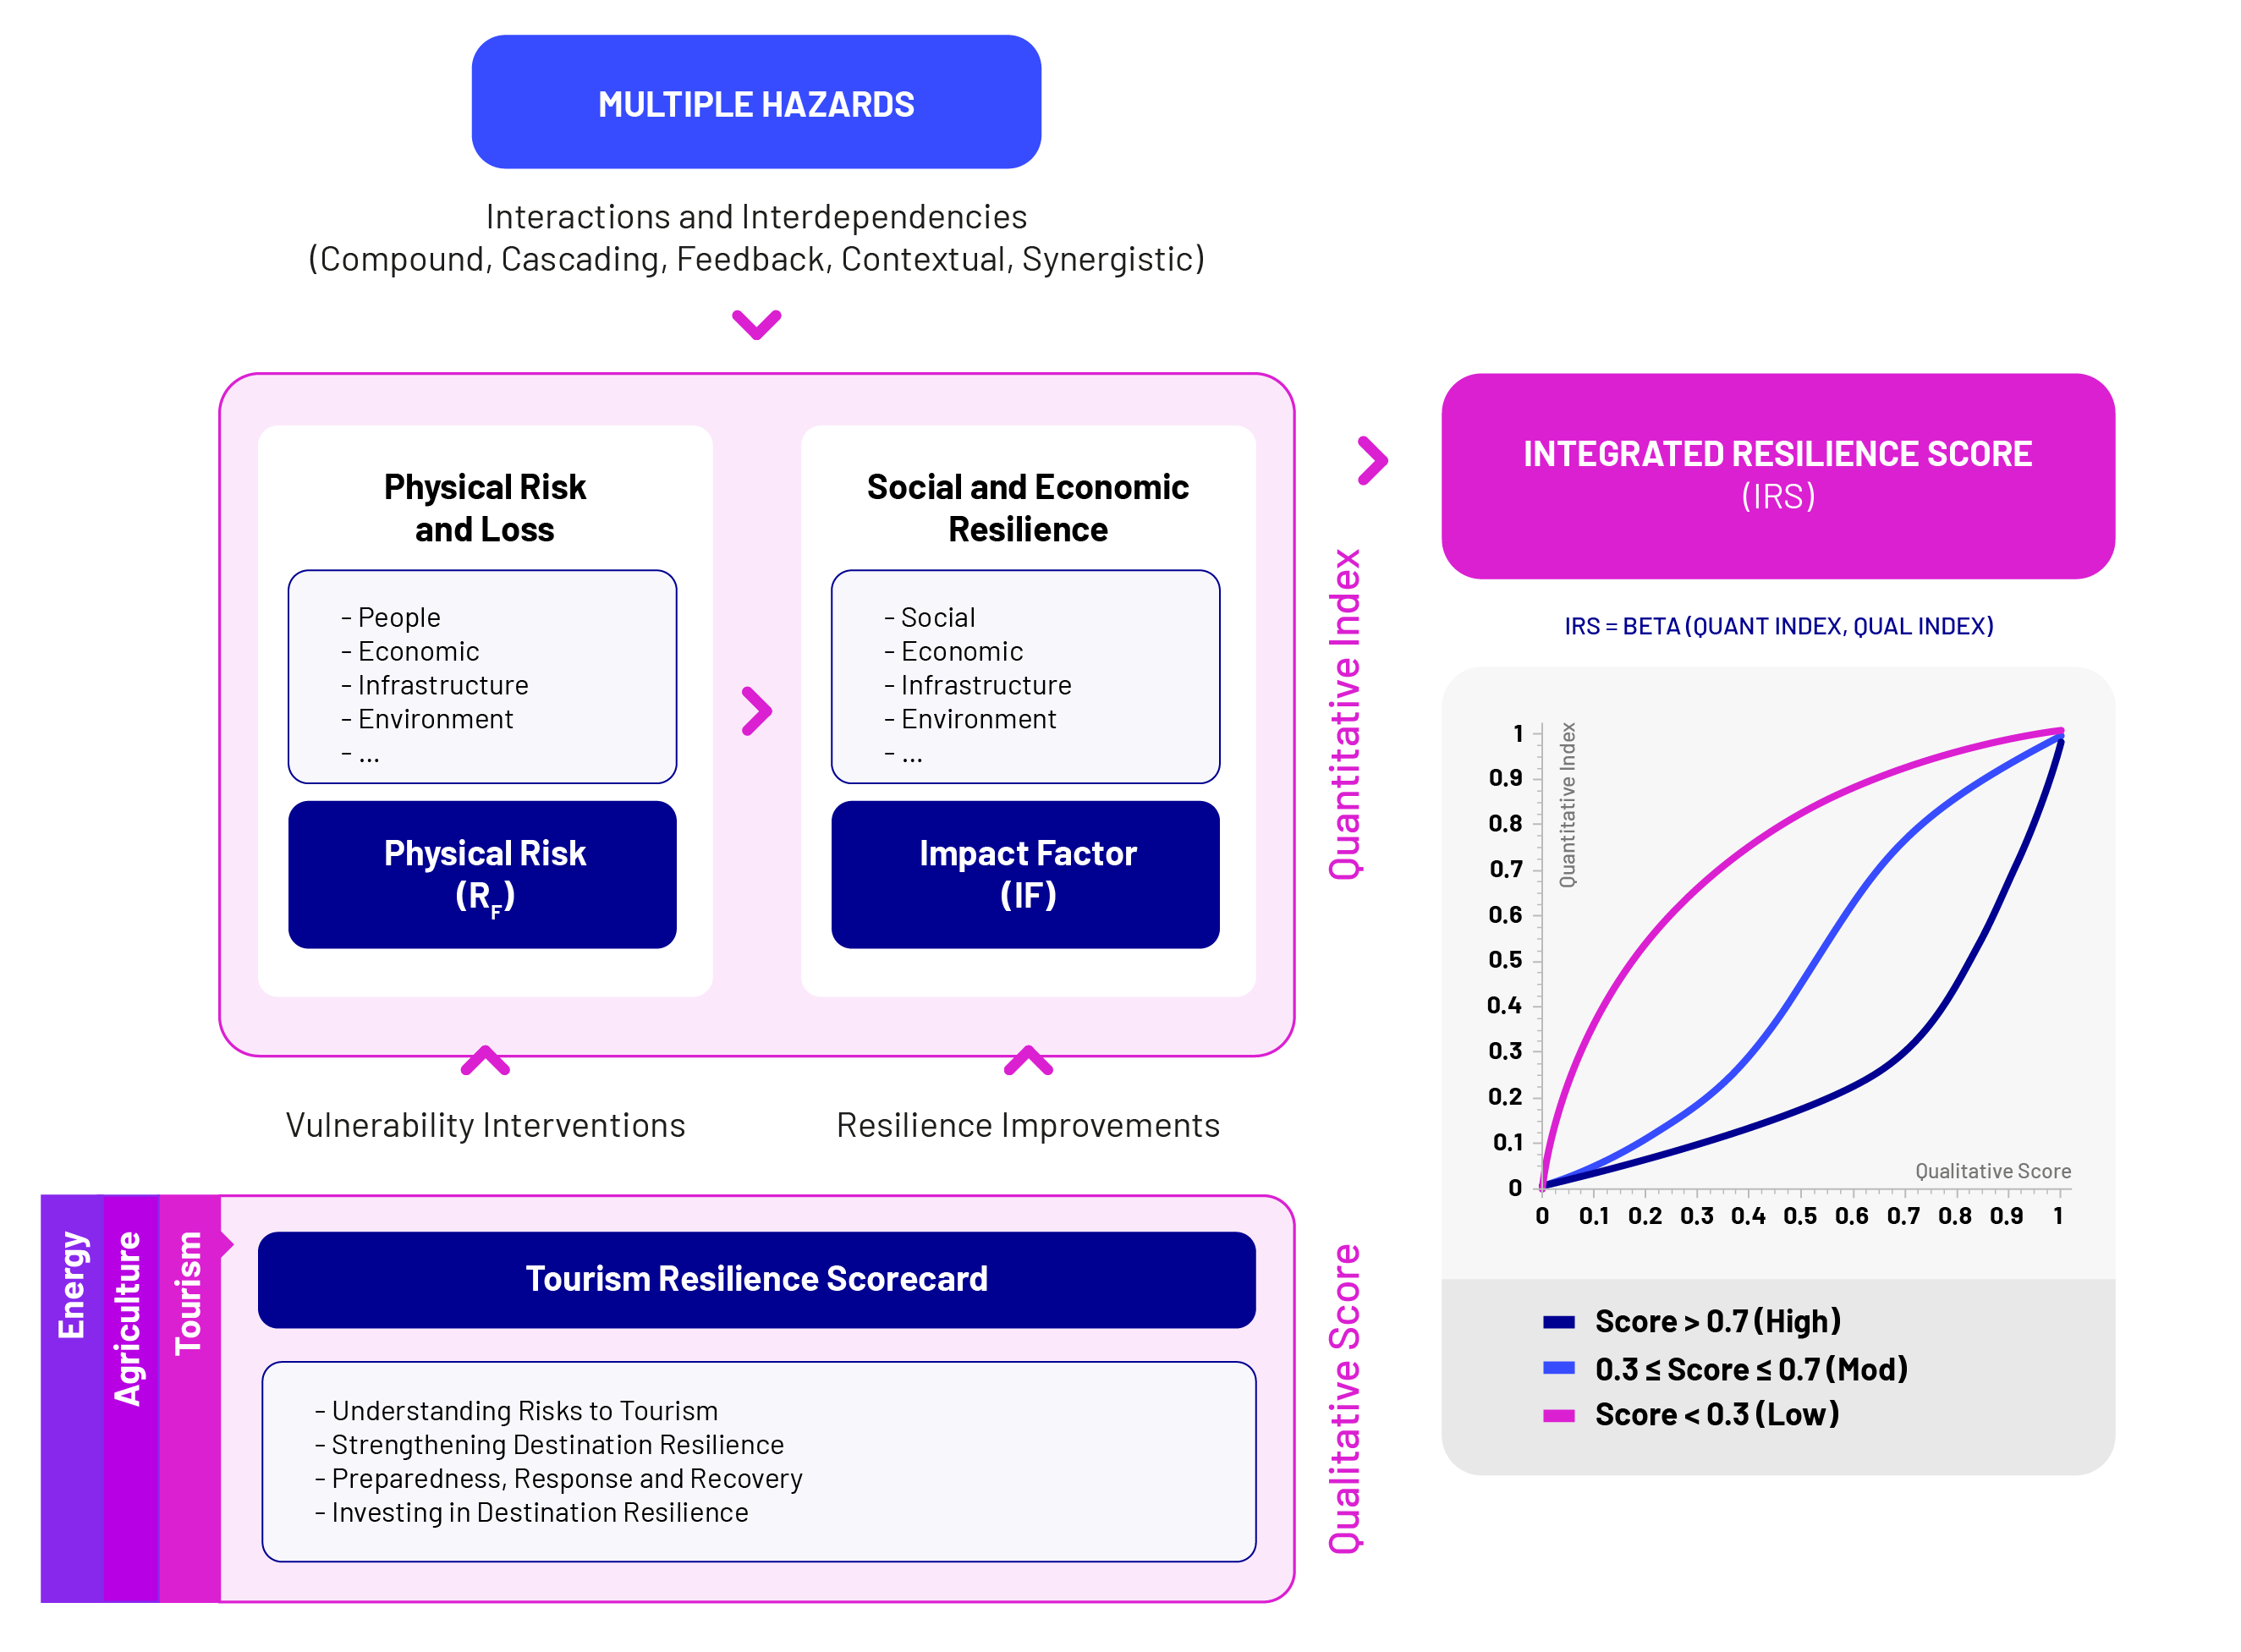
An Integrated Semi-Quantitative & Qualitative Approach:
We developed an integrated approach to evaluating the direct and indirect risks. The methodology used in the software therefore combines a semi-quantitative baseline resilience index with qualitative resilience scorecard assessments, resulting in a comprehensive analysis of resilience. Such a comprehensive approach is important for capturing nuanced aspects of resilience, aiding organizations and policymakers in developing targeted strategies to enhance their preparedness and response capabilities across different scenarios and sectors.
- Semi-Quantitative baseline resilience index using a multi-dimensional approach focusing on social, economic, institutional, and infrastructural resilience.
- Qualitative resilience scorecard assessments for capturing different dimensions of resilience for different sectors.
The results of the semi-quantitative baseline resilience index and qualitative assessments will be visualized in an Online Platform. The prototype is designed to function as a tourism resilience observatory for the Canary Islands pilot. This Platform will facilitate the collection and analysis of risk and resilience data, enabling decision-makers to strategically address pertinent questions, prioritize actions, and monitor resilience progress for the destination of La Palma.
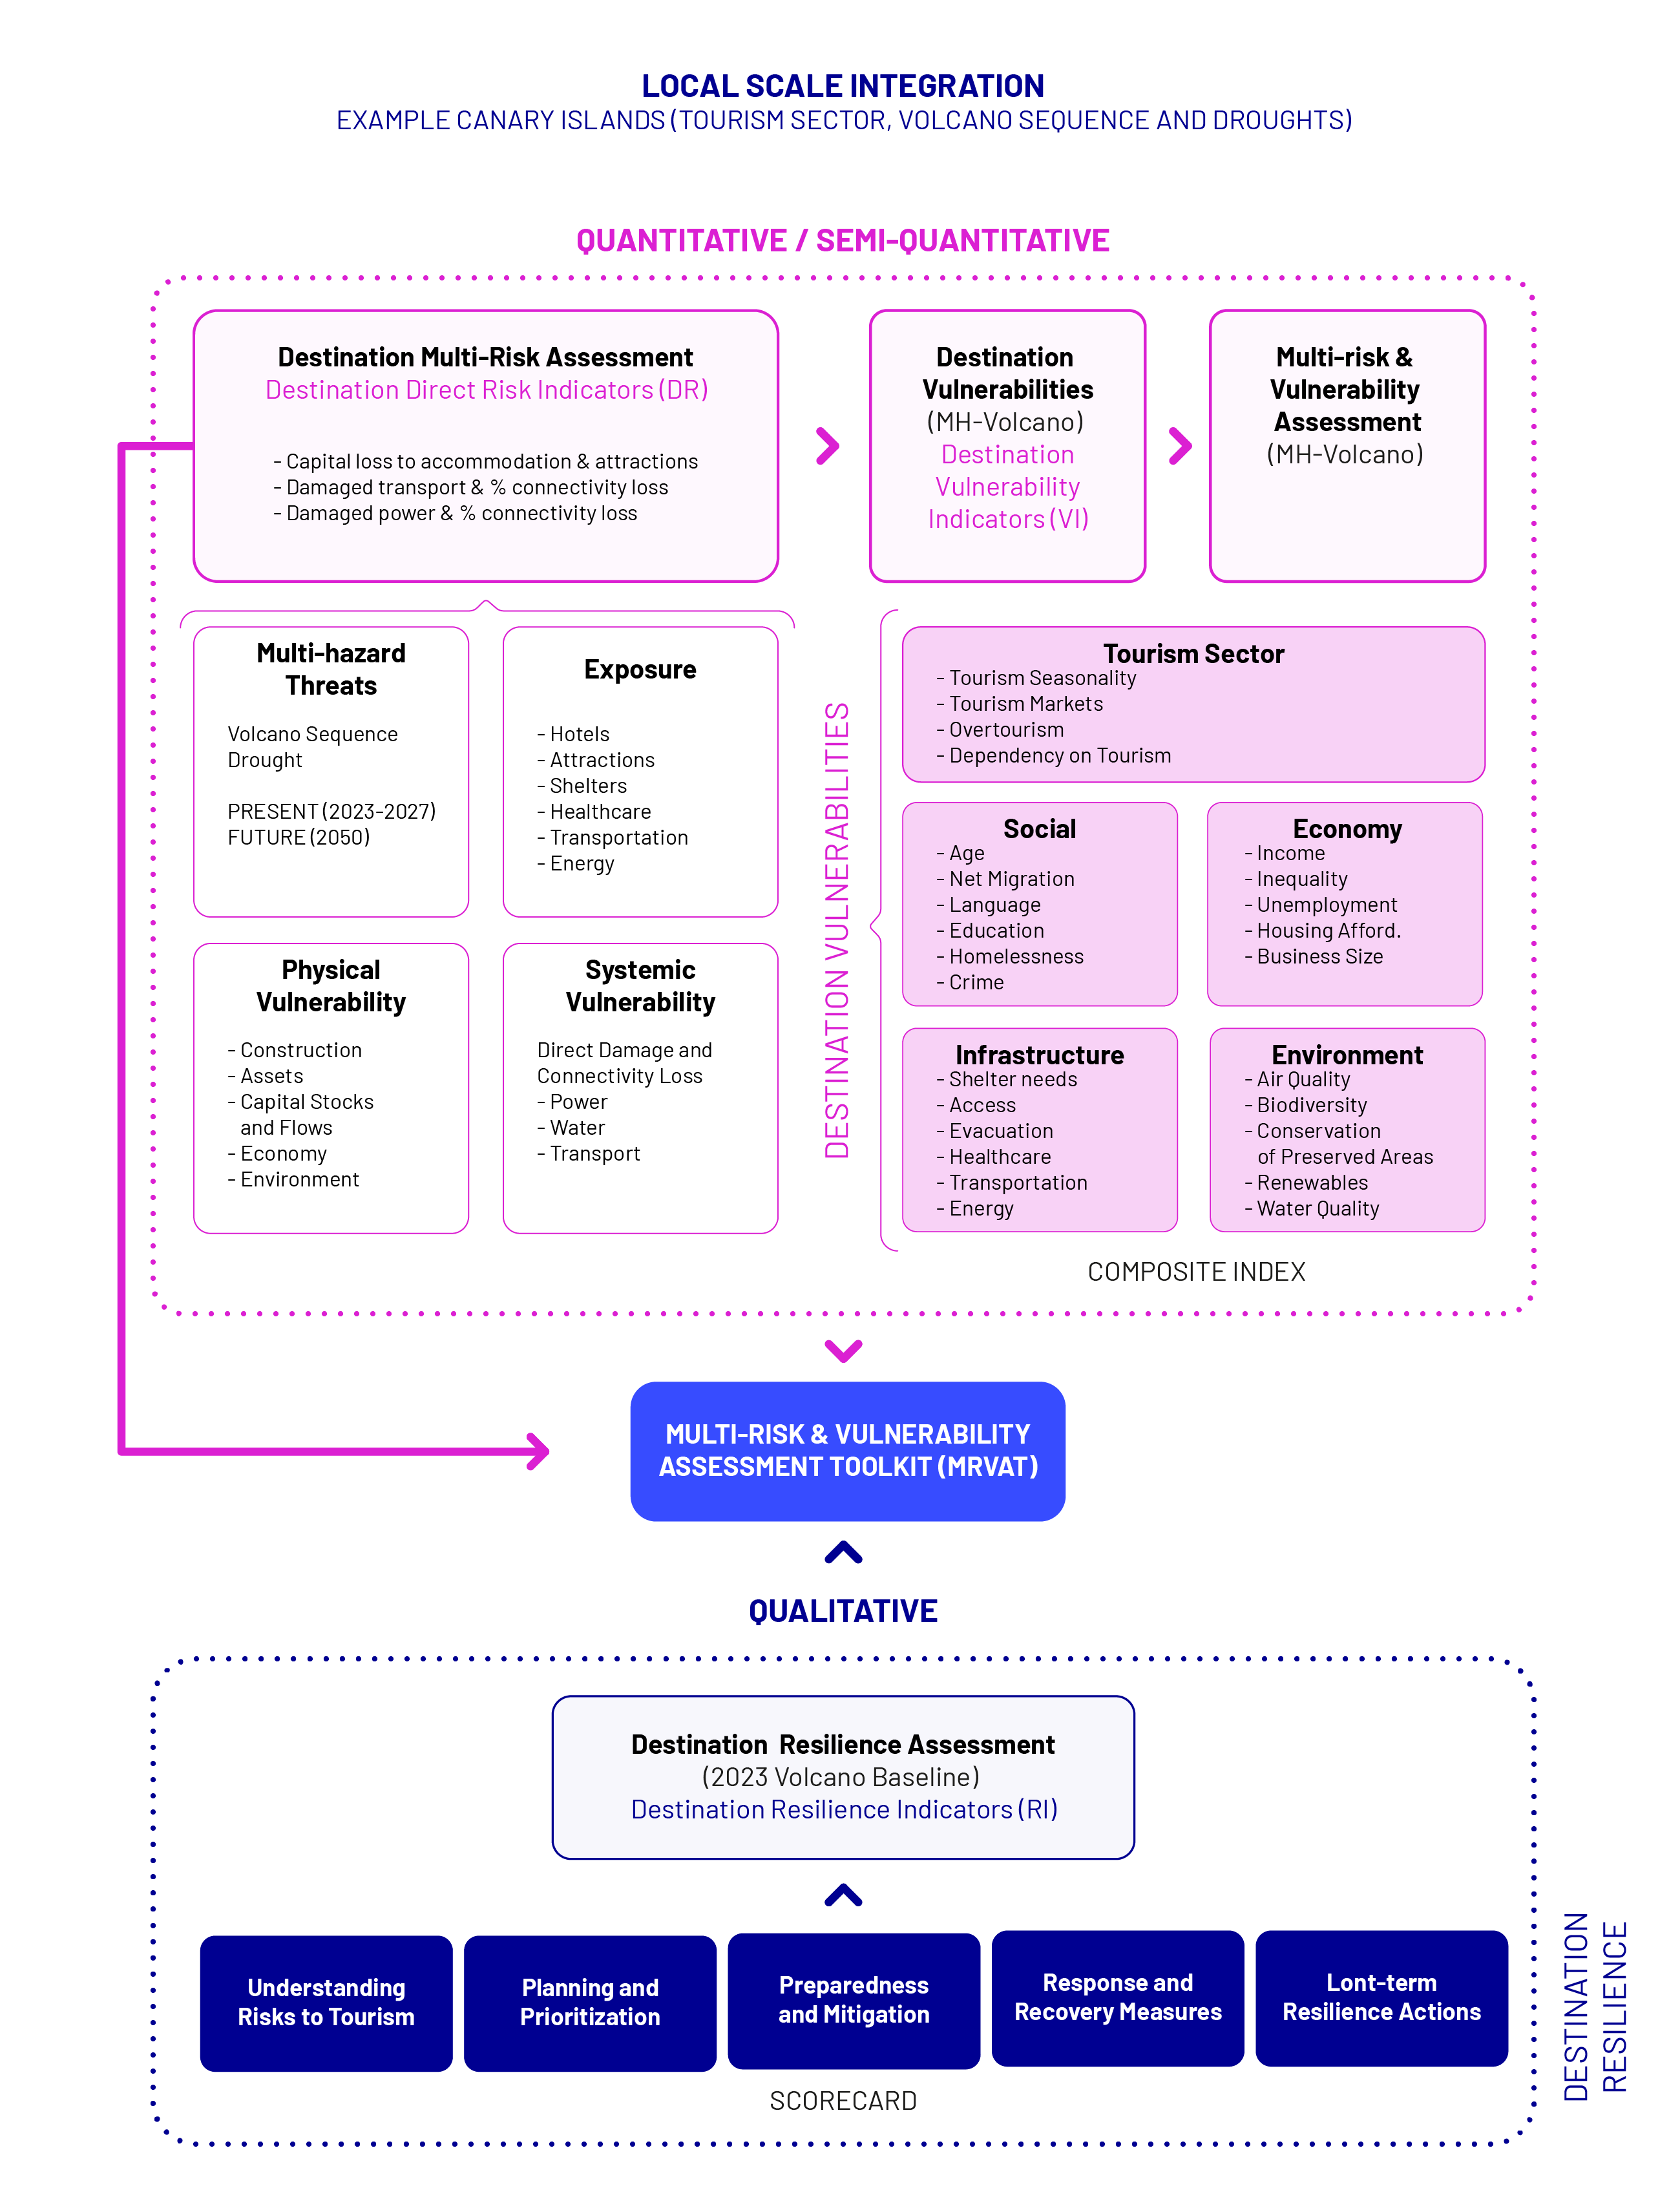
Schematic from Pilot in La Palma (Canary Islands) that will examine multi-hazard scenarios, including current and future (projected) volcanic events and drought conditions in 2050, and their impact on the tourism infrastructure.
ACCOUNTING FOR FUTURE SYSTEM STATE
To ensure a comprehensive understanding of how future climatic conditions might impact the system, we integrate a variety of advanced climate models. The following future climate models have been incorporated:
CMIP6: “Coupled Model Intercomparison Project” Phase 6:
Latest iteration of the WRCP global climate model (Eyring et al. 2016), CMIP provides common standards for comparativeness between different climate models.
- NEX-GDDP-CMIP6: global downscaled climate scenarios. Global, high resolution, bias-corrected climate change projections
- Time dimensions: Historic: 1950 -2014. Future: 2015 - 2100
RCP (Representative Concentration Pathways) & SSPs (Shared Socio-economic Pathways)
Describes model input assumptions for certain pathways of human development and decarbonization
- SSP1-2.6 Sustainability - Taking the green road
- SSP2-4.5 Middle of the road
- SSP3-7.0 Regional rivalry - A rocky road
- SSP5-8.5 Fossil-fueled development - Taking the highway
Climatic hazards present complex challenges that vary widely from extreme cold events to wildfires and droughts. Leveraging a suite of sophisticated datasets like RAIN, ERA-5 and EFFIS, among others, we can model and predict future scenarios to help decision makers better plan, mitigate or adapt to future climatic hazards.
The following is a list of Climatic Hazards that can be potentially analyzed through the software and future scenarios predicted by the models linked to the software:
- Hail, Blizzard, Snow, Freezing Rain and Winter Weather (RAIN, ERA-5, KIT)
- Fire Weather Indices, Forest Fire (EFFIS, RAIN, ERA-5)
- Drought (OWDA, DFO, ERA-5, WRI, Historical Datasets) and Heatwaves
- Thunderstorm and Lightning (RAIN, ERA-5)
- Volcanic Hazards (Wind)
- Wind (RAIN, Future)
- Flood
- Storm Surge / Wave Action / Coastal Impacts
- Ocean Metrics (Sea Level and Acidification)